Blog
The Best Google Analytics Reports You Should Know
Published 8/6/2021
Reading Time: 4 minutes
Google Analytics is a billion dollar software that you can install and use on your website for free!
Most companies selling products or services online will generally just look at how many visitors come to the site, and how much revenue they bring.
While these are always exciting reports to view, there’s a few which will show you how to take action and potentially further increase your visitors and revenue.
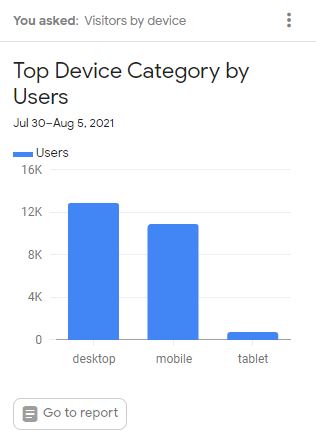
- Visitors by device (Mobile, Tablet, Desktop)
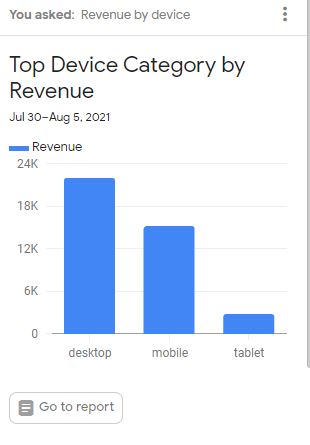
- Revenue by Device (Mobile, Tablet, Desktop)
- Which pages have the highest bounce rate
- What sources are your customers are coming from
If you do not already have Google Analytics set up on your website you can checkout our quick guide here: Get Started with GA